What is a network?
At their simplest level, networks are a system of interconnected datapoints. The datapoints that comprise a network can take the form of many different types of data, and are highly customizable to suit a number of different analytical frameworks. The defining feature of a networks is that all of the datapoints within the network are connected by pairwise vectors. These vectors contain information that links the two connected datapoints in some way. In general, networks are comprised of two components: nodes (or vertices), and edges. Nodes are the datapoints that we mentioned earlier, and edges are the vectors that connect two nodes.

Networks are useful for a number of different types of analyses, and they are highly informative in the way that they display show how different datapoints are connected. When analyzing and displaying phylogenomic data in cloudforest, this informativeness enables us to dive deeper into all sorts of facets of our data.
Forming networks with phylogenetic trees
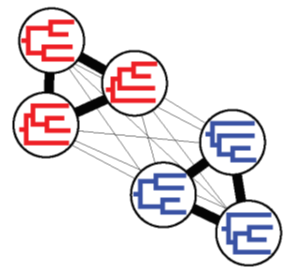
One basic way to contextualize phylogenetic trees in relation to networks is to look at a scenario in which individual trees themselves are the nodes in the network. With the trees as nodes in our network, we can then think of ways in which we can connect the nodes based on relationships between the trees. A simple way to do this would be to use a measure of relatedness, like tree-to-tree distances. Tree-to-tree distances, such as the Robinson-Foulds distance (among others), provide us with numerical approximations of how similar two phylogenetic trees are based on their individual branching patterns. Two trees that are very dissimilar will have a large distance between them, and vice versa. In CloudForest, we can calculate tree-to-tree distances in a pairwise fashion in order to compute distances between each pair of trees in the treeset. Then, to convert these distances into a form more usable by networks, we convert them into affinities. Put simply, affinities represent the inverse of distances, such that two very similar trees (trees with a small distance) will have a large affinity. Then, we can form a network in which the trees are the nodes, and the edges connecting them are scaled according to their affinity. These affinity networks are useful in their own right, but become even more powerful when combined with NLDR visualization and community detection algorithms, as described in this tutorial, that act on the underlying affinity network to find groups of trees.

Networks of Bipartitions
Another powerful use for networks available within CloudForest is in finding patterns of occurence of individual bipartitions within a treeset. In this context, bipartitions represent splits in the tree that distinguish groups of taxa within the tree.
In CloudForest, each tree in a treeset can be broken down into its consituent bipartitions. Then, how often or how not-often individual bipartitions co-occur within the same tree can be measured using the statistical concept of covariance. In essence, bipartitions that frequently occur in the same tree together will have a large positive covariance, while bipartitions that rarely (if ever) occur together in the same tree will have a large negative covariance. Measuring covariance in this way gives us direct insight into the sources of discordance present in a set of trees by allowing us to observe which specific bipartitions are the major source of conflict, and which bipartitions are concordant among competing phylogenetic hypotheses.
Now that we’ve computed covariances between the set of bipartitions that comprise the entire treeset, we can translate this information into a network. To do so, we use the bipartitions themselves as the nodes in our network. Then, we connect these bipartition nodes using our measurements of covariance between bipartitions as their edges. In this instance, however, since we have two different directions of covariance (positive and negative), we distinguish the positive and negative edges as blue and red, respectively. Now that we’ve assembled our bipartition-covariance network, we can visualize it in CloudForest, alongside a set of trees, in order to see where the bipartitions with large positive and negative covariances lie within our trees in order to determine major sources of concordance and discordance. The process or computing and visualizing bipartition-covariance networks is outlined in this tutorial.

Now that we know what networks are, and some of the ways we can use them to analyze phylogenomic in CloudForest, we’re ready to analyze data! Head to the tutorials linked on this page to walk through the analyses mentioned with your own data or the data provided, and to start uncovering interesting facets of your phylogenomic results!
